The anthropogenic global warming (AGW) hypothesis presented by the majority of today's climatologists has two parts. First it claims that the world is getting exceptionally warm, and second it claims that human carbon dioxide (CO2) emissions are the cause of this warming. Seven years ago, we began our personal investigation of this hypothesis, and we did so by considering whether or not the world was indeed getting exceptionally warm.
The first thing we did was estimate the uncertainty inherent in the measurements of global surface temperature. We concluded that natural variations in local climate introduce an error of roughly 0.14°C in the measurement of the change in temperature between any two points in time. The fact that the error is constant with the time over which we measure the change is a consequence of the particular characteristics of local climate fluctuations.
We downloaded the weather station data from NCDC and calculated the global surface anomaly using a method we called integrated derivatives, but which others have called first differences. The graph we obtained was almost identical to the one obtained by CRU using their complex reference grid method. It remains a mystery to us why institutions like CRU, NASA, and NCDC use such a complex method when a far simpler one will do. All graphs show roughly a 0.6°C rise in global surface temperature from 1950 to 2000. This rise is significant compared to our expected resolution of 0.14°C.
We made this plot superimposing the number of weather stations and the global surface anomaly versus time. The number of weather stations drops dramatically from 1960 and 1990. Only one in four remain active at the end of this thirty-year period. During the same period, the global surface anomaly shows a 0.6°C rise. By selecting subsets of the weather stations, we found that the apparent warming from 1950 to 1990 varied from 0.3°C to 1.0°C depending upon whether we used stations that disappeared in that period, persisted through that period, or existed shorter or longer intervals in the same century. Thus is seemed to us that some significant amount of work would have to be done to eliminate the change in the number of weather stations as a source of error in the data. But we saw no mention whatsoever of this source of error in published papers in which the global surface anomaly is presented, such as Jones et al..
We plotted a global map of the available weather stations, color-coded to show the date they first started reporting. The map shows that almost all stations in the tropics began operating after 1930, while most of those in the temperate regions were operating by 1880. This seems to us to be another source of systematic error in our measurement of the global surface anomaly.
Weather stations might also be affected by the appearance of buildings, tarmac, and road traffic. We found examples of weather stations in which such urban heating caused an apparent warming of several degrees centigrade over a few decades. It seemed to us that this effect would have to be examined in depth by any paper presenting a global surface trend. But papers such as Jones et al. do not address the urban heating issue directly. Instead, they claim that the effect is negligible and refer to other papers as proof. But when we looked up those other papers, we did not find any such proof.
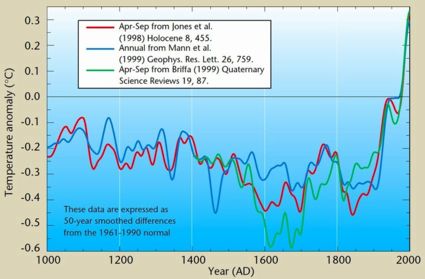
In order to argue that modern temperatures were exceptionally warm, climatologists produced the hockey stick graph, in which a collection of potential long-term measurements of global surface temperature were combined together under the assumption that they could be trusted only to the extent that they showed a temperatures increase from 1950 to 2000. Indeed, if a measurement showed a temperature decline in that period, the hockey stick method would flip the trend over and add it to the combination so that it now contributed to a rise in the same period.
The hockey-stick graph shows no sign of the Medieval Warm Period, in which Greenland was inhabited by farmers, nor the Little Ice Age, when the Thames was known to freeze over, and nor should we expect it to. Given a random set of measurements, the hockey-stick combination method will almost always produce a graph that shows a sharp rise from 1950 to 2000 and a gentle descent during the thousand years before-hand. When applied to the existing measurements of temperature by tree rings, ice cores, and other such indirect methods, it is no surprise that the method produced that same shape.
We presented our doubts about the surface temperature measurements and the hockey stick graph to believers in the AGW hypothesis. We were received with disdain and given no satisfactory answers. Furthermore, the Climategate affair revealed several significant breaches of scientific method by the climate science community. For example, in this graph produced by climatologists for the World Health Organization, the authors removed the tree ring temperature data from 1960 onwards because it showed a decline in temperature, and substituted temperature station measurements in their place. They plotted the combination as a single line. When I asked a prominent climatologists what exactly had been done, he said, "The smooth was calculated using instrumental data past 1960." He declared that a better way to handle the divergence of the tree-ring data from the station measurements would be to cut short the graph of tree-ring data at 1960, so as to hide the decline in temperatures measured by the tree rings.
What we see here is the assumption by climatologists that the world has been warming up and that the global temperature measured by weather stations is correct. This assumption leads them to delete conflicting data on the grounds that it must be bad data. Thus it becomes impossible for them to discover that their assumption is incorrect. By this time, we were skeptical of the global surface anomaly we obtained from the station data. We were no longer certain that the data itself had not been modified by NCDC. We had little reason to trust any other measurement produced by climatologists, we were unimpressed with the hockey-stick method of combining measurements, and we were quite certain that recent temperatures were not exceptional for the past ten thousand years.
We turned our attention to the second part of the AGW hypothesis: the one that says doubling the atmosphere's CO2 concentration will increase the surface temperature by roughly 3°C. It took us a long time to come to a conclusion on this one. The climate models upon which such predictions are based are private property of various climatologists. In any event, we do not trust models produced by a community that is willing to delete data that conflict with its assumptions. If they are willing to delete data, we must assume that they are willing to adjust their models until the models give predictions consistent with their AGW hypothesis.
We began with some laboratory experiments on radiation. We stated the principle of the greenhouse effect. After a great deal of searching around, we eventually obtained the absorption spectrum of various layers of the Earth's atmosphere. This allowed us to confirm that, if the skies remained clear, a doubling of CO2 concentration would cause the world to warm up by about 1.5°C.
But of course the skies don't remain clear. The formation of clouds is a strong function of surface temperature. If the world warms up, there will be more clouds. They will reflect more of the Sun's light, while at the same time, slowing down the radiation of heat into space by the Earth. To determine how these two effects would interact, we built our own climate model, which we called Circulating Cells.
When it comes to determining the effect of increased cloud cover, the most critical parameter to decide upon is the reflection of sunlight by clouds per millimeter of water depth in the cloud. It seemed to us that there should be a large body of literature written recently upon this subject because it is so important to climate modeling. The best paper we found upon the subject was written in 1948, Reflection, Absorption, and Transmission of Insolation by Stratus Cloud. We found a couple of more recent papers about reflection, such as this one, but they do not attempt to provide an empirical formula for the reflection of clouds with increasing cloud depth. We concluded that climatologists are not examining this issue in detail.
In a long sequence of small steps, we built up our climate model until it implemented surface convection, surface heat capacity, evaporation, cloud formation, precipitation, and radiation by clouds. We tested every aspect of the simulation in detail, and based its operating parameters upon our own estimates and upon whatever measurements we could find in climate science journals. We did not choose our model parameters to suit any hypothesis of our own, nor could we have done, because we did not have a model capable of testing the AGW hypothesis until the final stage, and we did not change the parameters in that final stage.
The latest version of our climate model shows that cloud cover increases rapidly as the surface warms above the freezing point of water. The evaporation rate of water from the surface increases approximately as the square of the temperature above freezing, and the only way for water to return to the surface is to form a cloud first. If we ignore the increased reflection of sunlight due to increasing cloud cover, and consider only the slowing-down of radiation into space by the same increase in cloud cover, our model shows roughly 3°C of warming due to a doubling in CO2 concentration. But when we take account of the increased reflection of sunlight by the increasing cloud cover, the warming drops to 0.9°C.
It seems to us that the climate models used by climatologists ignore the reflection of sunlight due to clouds. They may allow for some fixed fraction of sunlight to be reflected by clouds, but they do not allow this fraction to increase with increasing surface temperature. Thus they conclude that the warming due to CO2 doubling will be 3°C. If they took account of the increased reflection, the effect would be far smaller and less dramatic: roughly 1°C.
Doubling the CO2 concentration of the atmosphere will indeed encourage the world to warm up, but not by enough that we should worry. Right now CO2 concentration has increased from roughly 300 ppm to 400 ppm in the past century. If it gets to 600 ppm then we can say that the rise in CO2 concentration will tend to warm the Earth by 1°C. But we are unlikely to be able to check our calculations, because the natural variation in the Earth's climate is itself of order ±1°C from one century to the next.
And so we find ourselves at the end of our journey. Modern warming is not exceptional, and doubling the CO2 concentration will cause the world to warm up by roughly 1°C, not 3°C. The only part of the AGW theory we have not investigated is its assertion that human CO2 emissions are responsible for the increase in atmospheric CO2 concentration over the past century.
My thanks to those of you who took part in the effort, both by private e-mails and in the comments. I would not have continued the effort without your participation. I hope it is clear that my use of "we" instead of "I" is in recognition of the fact that this has been a group effort. I will continue to answer comments on this site, and I will consider any suggestions of further work. To the first approximation, however: we're done.
Wednesday, April 4, 2012
Subscribe to:
Posts (Atom)
